Customer retention is a key challenge for companies across all industries.
Understanding why customers leave and what keeps them engaged is essential for long-term success.
In the banking industry, churn is a persistent issue.
This turnover can lead to significant revenue loss for banks.
How can we better retain customers?
Analyzed a bank churn dataset.
Leveraged machine learning
Uncover the most telling predictors of customer retention.
Identify at-risk customers.
Our findings helps banks implement retention strategies based on insights.
Process
For this project, we used a dataset from Kaggle. The data consists of 10,000 observations with 14 features, including
customer ID
surname
credit score
geography
gender
age
tenure (number of years as a customer)
balance
number of bank products customer uses
has credit card
is active member
estimated salary
exited
For more information on each variable, check out the codebook in our GitHub repository.
EDA
After importing the data, we checked for missing and duplicate values. We found only one missing and 3 duplicated rows, so we decided to drop them. We also dropped the row number, id, and surname columns since they only contained identifying information, which is not useful for prediction.
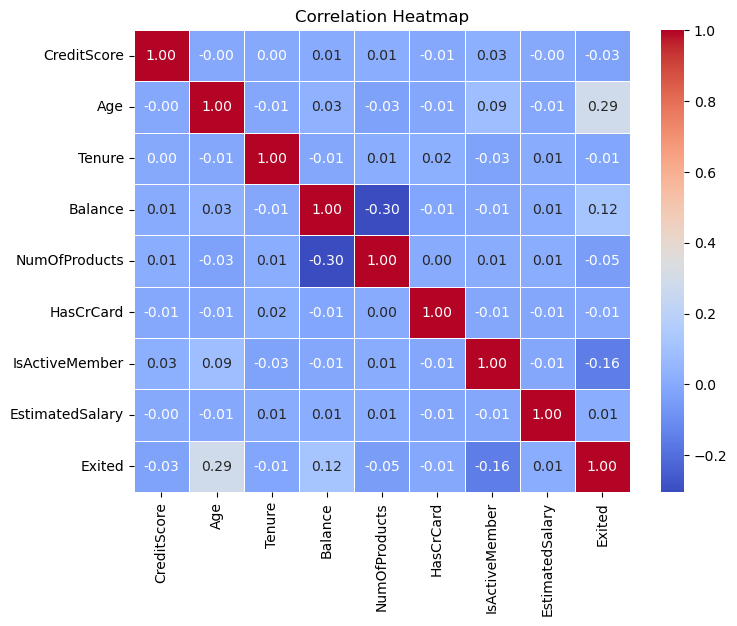
We then used a correlation plot to visualize relationships between variables.
As we can see, not many variables were highly correlated. This is good, as multicollinearity can introduce issues such as overfitting and decreased performance and computational efficiency.
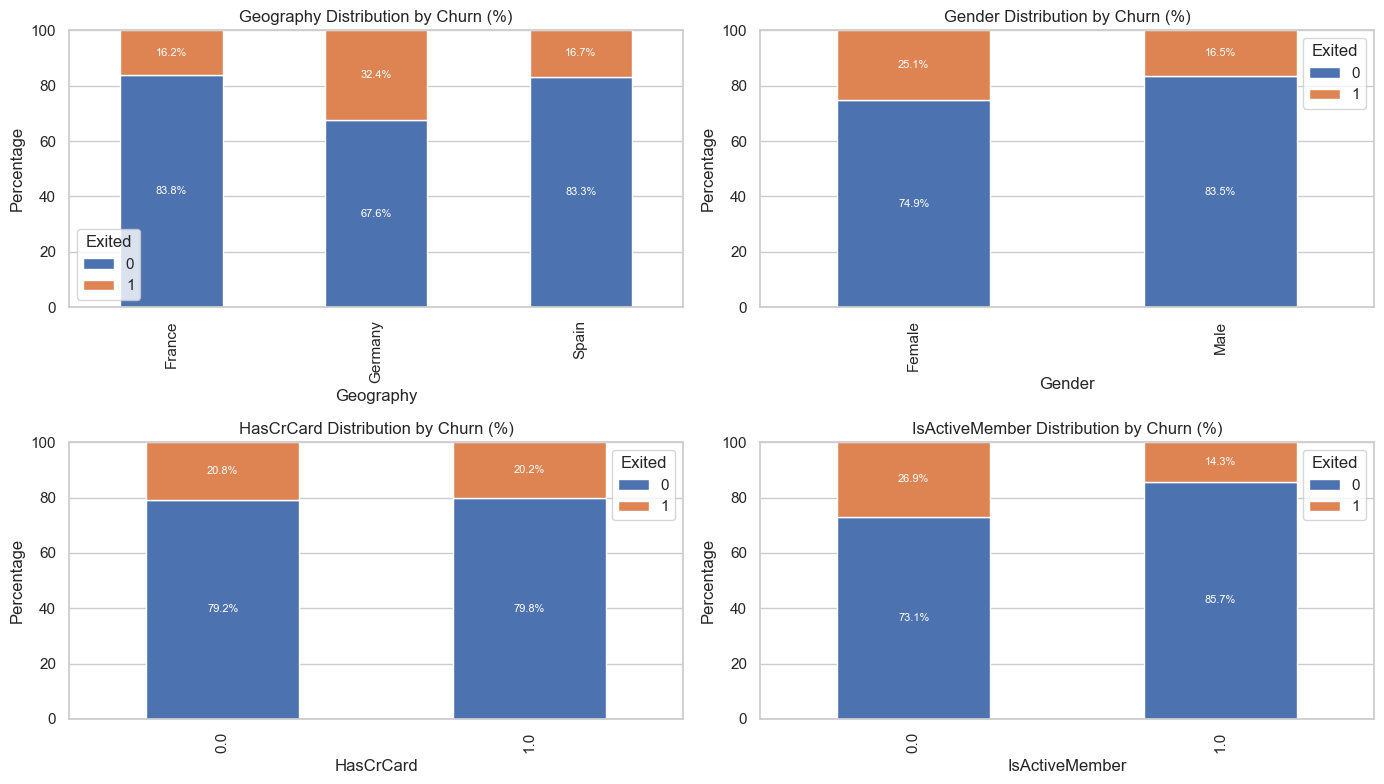
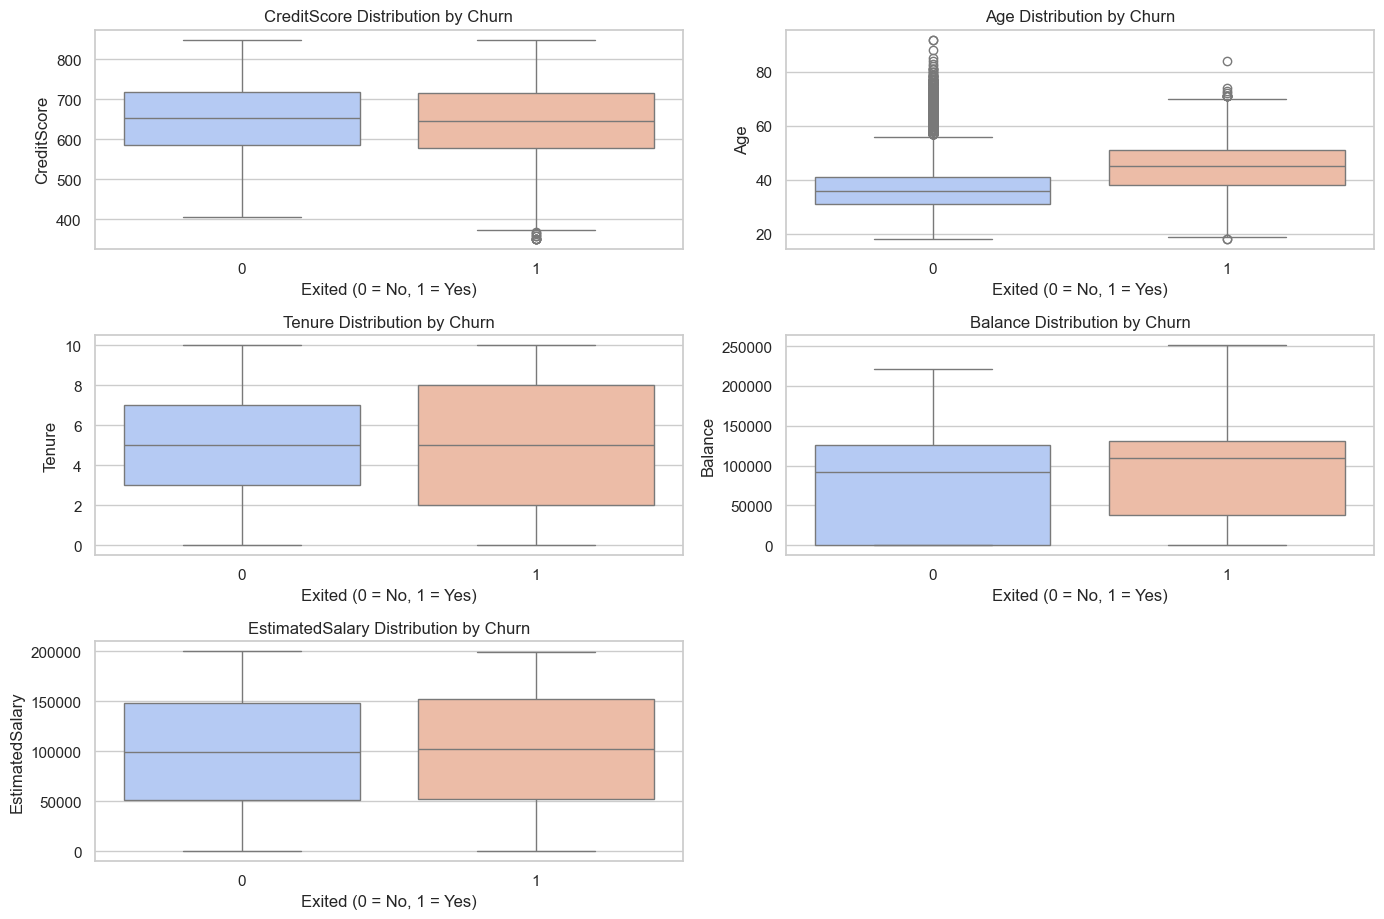
Next, we looked at each variable and plotted them against churn. The biggest differences in distribution occurred in has credit card, age, balance, and is active member. Based on this insight, we might expect that these variables will play a crucial role in our models.
When examining the distribution of those who churned, we noticed a large difference in the number of positive and negative cases. While it may not seem like an issue, the discrepancy in cases can cause problems when fitting models. The model would not have enough data to determine patterns in the minority case, decreasing accuracy. To fix this, we used oversampling, or duplicating minority cases, to balance the class distribution.
Models
To better understand which customers are likely to churn, we created several classification models. We began by splitting our dataset into a training set (to build the models) and a testing set (to check how well the models predict unseen data). Since we’re predicting a yes-or-no outcome—whether a customer will churn—we used common classification algorithms:
Logistic Regression: Estimates how various factors increase or decrease the likelihood of churn.
K-Nearest Neighbors (KNN): Looks at the “neighbors” (similar customers) to decide if a new customer is likely to churn.
Decision Tree: Uses a series of simple “if-then” rules to classify whether a customer will churn.
Random Forest: Combines multiple decision trees to make more robust predictions.
Boosted Tree (XGBoost): Improves predictions by building new trees that focus on the errors made by previous trees.
After training each model, we measured their accuracy—the percentage of correct predictions out of all customers—and also compared their ROC AUC scores (a measure of how well the model distinguishes churners from non-churners). The formula for accuracy is:
Among these models, KNN and Random Forest achieved the highest AUC, so we tested these two further on the unseen data (test set). Random Forest ultimately produced the highest accuracy, making it our top choice. Because we want to focus on the factors that truly matter for churn, we refitted the Random Forest model after removing variables that appeared less important. This helps simplify our model and concentrate on the key drivers of churn.
Deployment
After finalizing our model, we used Streamlit to create an interactive dashboard for users to predict bank churn. We chose Streamlit since it was fast, simple, and able to easily create interactive features.
We first tested the dashboard locally to finetune the functionality and interface. Once we were satisfied with the app's performance, we deployed it to the cloud using Streamlit Cloud, making the dashboard easily accessible for users. This deployment ensured that the app was available for real-time predictions, offering a seamless user experience.
Results
Highest Performing Model: Random Forest emerged as the top predictor, reaching 81.8% accuracy in identifying at-risk customers.
Key Factors: Age, Estimated Salary, Credit Score, and Balance most strongly influence churn, with Age as the top driver.
High-Risk Segments: Customers over 40 and those maintaining very low or zero balances are more prone to churn.
Lower Risk: Individuals holding Good or Excellent credit scores tend to remain loyal.
Moderate Impact: Tenure shows some effect, but less than the top factors; Salary bins also displayed limited influence.
SHAP Insights: By grouping variables (e.g., Age and Balance) into bins and using SHAP, we confirmed which segments push predictions toward or away from churn.
Retention Strategies: Focusing on older customers with low balances—through personalized advice, loyalty rewards, or product bundles—can help reduce churn.
Ongoing Maintenance: Regularly retraining and monitoring the Random Forest model ensures accurate predictions and supports data-driven decisions over time.